Macro Analysis Around - Major Index Targets, Oil and Gold
Published on May 23, 2017 @ 9:17am
Our hearts go out to all of those families affected by the bombing in Manchester last evening. What a tragic event. It's unbelievable what these people are capable of doing. So many young teens and children. Just horrific. I truly wonder how anyone could do something so spineless and evil.
The markets are up yet again. As a matter of fact, another nice day to the upside and last week's selloff will have been all for not. However, we should all know by now these markets are capable of just about anything. Although it would appear they're on their way to new highs now, it's important to remember volatility doesn't always mean down.
The true definition of volatility, as far as we're concerned here, is big moves in either direction, and the more and more these markets start to get long in their daily, weekly and monthly bars in both directions, the more it will suggest the possibility of at least a top that could last a while.
We're not there yet, as we'll need much bigger moves over the next several days or weeks, but just keep this note in the back of your mind as we get more definitive technical data to work with going forward.
At this point, we've got some pretty definitive levels to work with in the event the major indices continue higher, or for some reason surprisingly break down again. It still remains to be seen, but it does look like we could end the month on a very positive note now. We'll just have to see.
Provided below are daily charts of both the S&P 500 and the NASDAQ Composite. As you can see, we've drawn some short-term expansion levels on both of these indexes based on their most recent trading wave patterns. Specifically, from the April bottom to the May high and then back off last week's low. Should they simply continue higher, we're probably looking at a move to roughly 6,221 on the NASDAQ and 2,429 on the S&P 500.
Those levels should serve as some sort of resistance, especially if we go there in a straight line. Additionally, for these levels to matter, both of these indices will have needed to hold last week's lows.
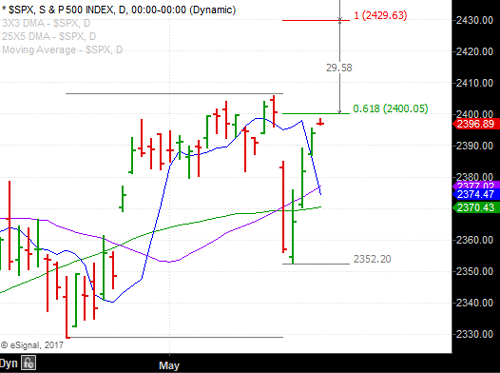
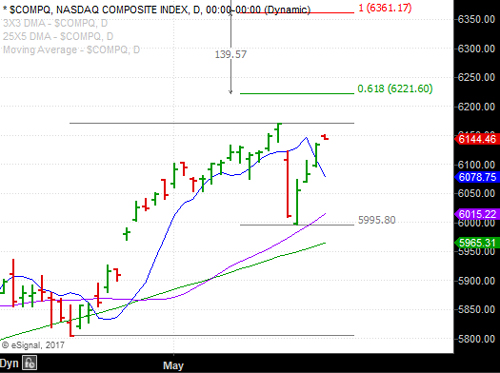
On much more of a long-term basis, we've got some much longer-term expansion levels that technically point to 6,300 on the NASDAQ and roughly 2,500 on the S&P 500. We are convinced both of these indexes are inevitably going to find their way to those levels.
As for a downside target, we're still sticking with the possibility of a break below 2,300 on the S&P 500. We've got a number of technical reasons to assume that level could be a potential bottom if it can get there. However, that too clearly remains to be seen right now.
It's becoming more and more important for everyone to pay attention not necessarily to where these markets go, but HOW they get there. Meaning, if they don't pause and starting running higher and higher without any sort of significant breather along the way, that's actually going to suggest a potential top looming, one that could last a long time when it's all said and done.
Conversely, if they can stage minor pullbacks and run-ups, that would suggest a far more orderly and safe market for the longer-term. That may sound a little counter-intuitive, but that's precisely how the markets tend to behave when they've achieved historical highs.
There's still no definitive technical or fundamental context to bet against these markets right now, so it's important traders don't get stubborn trying to peg a short-term top of any kind.
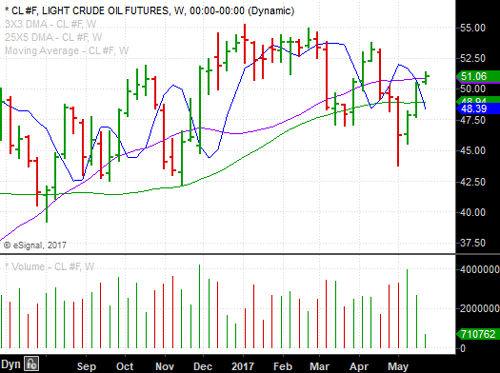
As for commodities, oil and gold both have surprisingly continued to do well along with the rest of the markets in recent days. However, both of these commodities may fast be approaching a near-term top as soon as today, or last late as tomorrow. Below is a daily chart of GLD, the primary ETF tracking the price of gold, and a weekly chart of oil - since light crude broke above a key short-term retracement level over the last few days on its daily chart.
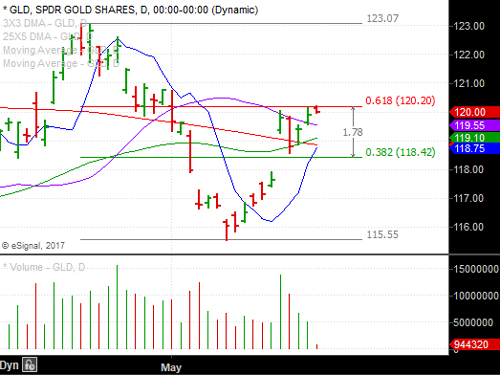
Basically, we've got gold right up against a key 5/8th's retracement level on declining volume, so it's going to be interesting to see if it starts losing its luster over the next few days. There's actually some pretty good technical context to suggest gold could break down around current levels. It's been tough trading commodities in general lately, but it does appear the volatility to the upside recently could run out of steam soon.
Oil, on the other hand, has surprised to the upside breaking right through what should have been short-term resistance on its daily chart this week. However, when you take a step back and look at the weekly chart, you can also see there's been a developing rounding top pattern with a series of lower highs over the last few months.
The bottom line is if oil is going to reverse itself, it should do it right around where it's at now, or somewhere just under $53 per barrel. So, if you're short oil based on our recent analysis, you could add to the position around $52 and change on the price of light crude. It's still a bit of a dicey trade, but the longer-term chart does suggest at least a pullback in the commodity soon.
What happens on the heels of that potential pullback though is going to help determine what oil's likely to do over the next several weeks.