NASDAQ Rolls Over - What To Expect
Published on June 12, 2017 @ 8:01am
A disastrous Friday for big NASDAQ tech, which got hit hard all day. As a matter of fact, the NASDAQ Composite had its single worst day in a very long time. Cause for concern? Near-term yes, long-term no. These markets have gotten very long in the technical tooth, something we've been pointing to for quite some time.
However, we're still not convinced these markets are done going higher on a long-term basis - not yet anyway. Although many of the big tech bellwethers got crushed on Friday, the selloff seemed to pretty isolated to just them, and some of those overly inflated growth stocks like Tesla (TSLA), another idea we've purposely stayed away from.
Now you know why we've opted for value lately, rather than chase running growth stocks higher. Interestingly enough though, many of our smaller names held up just fine Friday, and with all of the most important small cap ETF's having made new all-time highs last week, we do believe that technical breakout was meaningful on a longer-term basis.
Most of you know our target for quite some time on the NASDAQ Composite was right around 6,300, and although the S&P 500 has yet to achieve our target of 2,500, the NASDAQ did achieve the 6,300 level, and did manage to find its way slightly higher than that. All pretty normal activity considering its long-term charts. More on that in second.
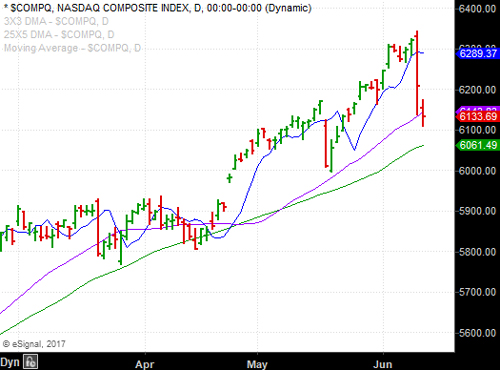
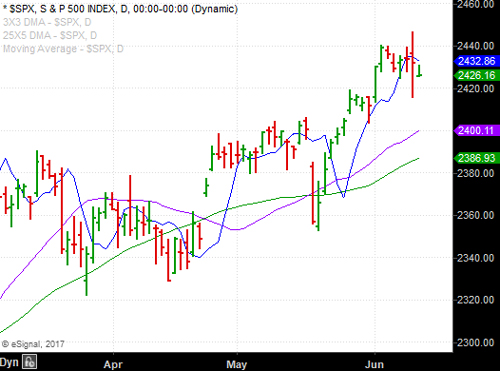
First, provided below is a daily chart of the NASDAQ Composite and the S&P 500. As you can see, the NASDAQ got clobbered, but the S&P 500 did end up almost flat on the day despite the volatility. You can also see the NASDAQ settled right smack on its 25X5 DMA (purple line) before providing some minor relief on Friday, and so far this morning it's still holding that level.
No guarantee at this point, but based on what's continued to take place for years, these markets could potentially reverse their current weakness at any point. However, when we drill down into the weekly chart of the NASDAQ here, you'll notice some very logical retracement levels - that if the selling persists - could be achieved.
The first level sits around 5,900, which is where a gap exists on its weekly chart, as well as a key first line retracement level on its monthly chart here. Should things really start to fall apart throughout the Summer, we could be looking at a move to as low as 5,600 to 5,500 when it's all said and done.
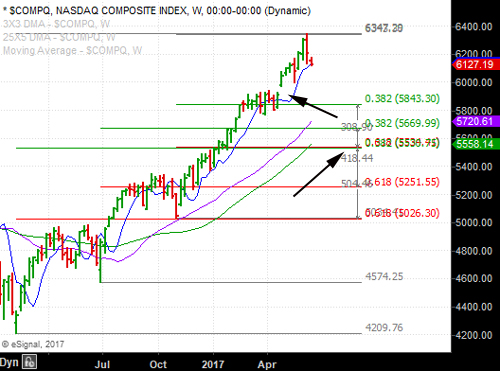
A move to either of those levels would not only be enough to scare the living daylights out of the bulls, it would also represent some of the most logical retracement levels - with one of them being a key confluence area we've pointed to here. In other words, a level whereby two key retracement levels perfectly meet - and that level is precisely at 5,534.
A move to there would not only wash out a lot of long-term die hard bulls, it would also represent probably the single best buying opportunity in tech we've seen in a very long time.
The bottom line is the volatility has definitely increased, however, we're still eyeing roughly 2,500 on the S&P 500. So, any sort of major selloff at this point would be very welcomed with respect to the very long-term landscape.
We'll know this week if Friday was merely a flash crash, or if it really was the beginning of a much bigger move lower.