Markets Behaving Suspect - Potential Selloff Looming
Published on October 10, 2017 @ 3:44pm
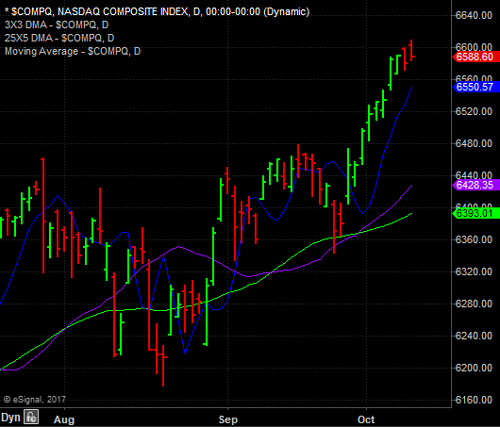
We started to see a little weakness developing yesterday across the major indices now that the markets have gotten ever so close to our previously published targets of roughly 2,558 on the S&P 500 and just under 6,700 on the NASDAQ Composite.
However, we're once again seeing strength on the open today - further suggesting an increase in volatility on the heels of yesterday's move lower. Now, we'll see how these markets continue to behave over the next few days as the above major indexes work to achieve our previously published target levels.
More importantly, should the major indices fail miserably to follow through on their gap up this morning, there will exist further technical context for a potential market-wide reversal developing over the next several days. That's what we're currently seeing on the NASDAQ already this morning, but what happens intraday isn't half as important as what happens heading into the close.
Until then, it's important traders sit tight and not attempt to jump the gun to the short side just yet. We'll let the markets tell us if and when it's ready for a short test via a bearish leveraged index ETF like SQQQ, SPXU or TZA.
For now, we'll continue to let our current open ideas work for us, in addition to our suggested bullish gold trade late last week in UGLD - the primary bullish leveraged ETF tracking gold. We got a nice reversal to the upside Friday when we suggested it, a strong gap up yesterday, and another gap up this morning, so it appears we've got a nice opportunity on our hands now.
Meaning, as long as you set a protective stop no lower than your entry, there's no way you can end up losing on the trade - only winning or break even at worse. And, it is possible based on how overly extended the major indices have gotten lately that gold could be the bigger winner over the next several weeks. We'll just have to see how things play out from here.
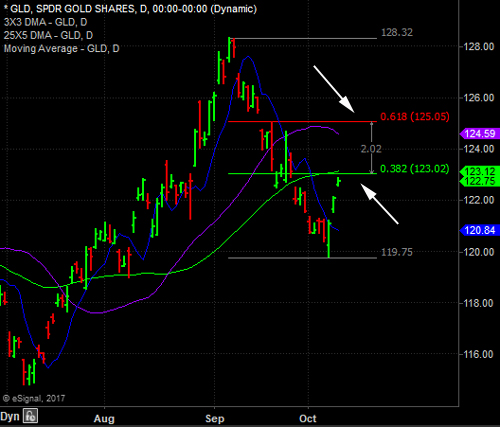
Provided below is a daily chart of GLD - the primary non-leveraged ETF tracking the price of gold. As you can see, the last few days of strength have definitely been encouraging, but we'll need a strong break above the first line resistance level of $123, and then another strong break above its final retracement level of $125 in order to confirm we've caught a potential long-term bottom.
If you're wondering why we use non-leveraged ETF charts to manage leveraged ETF trades, it's because leveraged ETF's are tied to the options markets, so they're not as reliable from a technical perspective as their non-leveraged counterparts. In other words, always use non-leveraged ETF's for entry and exit points on leveraged ETF trades.
The bottom line right now from both a trading and longer-term investing perspective is less is more. In other words, less active in speculative names, opt for value and hedge.
Actions To Consider Today:
Trail gains in any individual company ideas with protective stops you're comfrtable with.
Hold UGLD and trail gains with a protective stop at or slightly above your original entry price. If you haven't bought it already, now would not be the time. Wait for a potential pull back soon.
Individual Company Updates:
None
If you have any questions or would like further details regarding any of the information provided above - or anything else you're thinking about buying or selling out there - please don't hesitate to call your Rep . at 619-369-9316.