The Technical Tea Leaves - Oil, Gold and the Major Indices Updated
Published on May 29, 2018 @ 10:36am
A malaise week for the markets last week, and now it's renewed concerns over in Italy and Spain - nothing new. Regardless, the markets have opened lower to kick off the final week of trading for May. And, based on the way the markets continue to behave, it doesn't appear volatility is going away anytime soon.
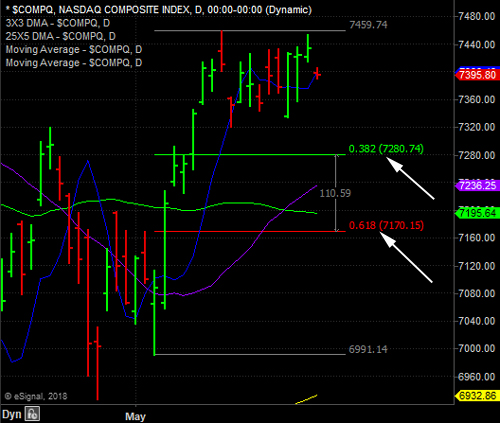
While both the Russell 2000 and the NASDAQ Composite continue to show stronger signs of potential new highs ahead, both the S&P 500 and the DOW are going to need to pick it up if we're going to see new highs there anytime soon.
This clearly puts the onus on tech and small caps in general. With energy now taking a hit - along with industrials, consumer goods, healthcare, and even financials - we're definitely going to need to see the major indices start climbing a wall of worry. It's an old market adage that exists for a reason. Meaning, despite what's now developing over in Europe, the markets can buck the concerns and start moving higher as soon as certain levels are achieved to the downside.
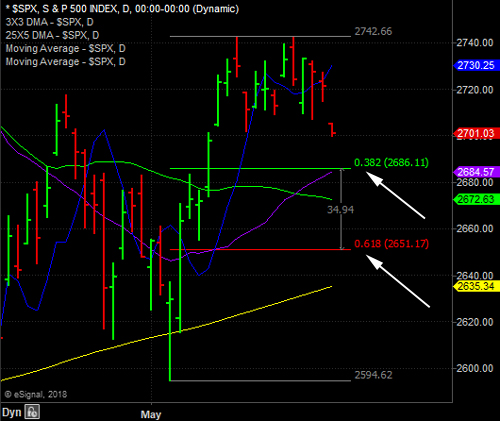
Specifically, last week we suggested the possibility of a move lower on the NASDAQ Composite to roughly 7,280, or potentially even 7,170, before the index might be in a position to find its footing again. If that ends up being the case, it will likely equate to roughly 2,686, or potentially even 2,651, before the S&P 500 could be in a position to reverse itself back to the upside.
The bottom line with respect to any short-term index ETF trading right now is there doesn't appear to be any real attractive risk/reward opportunity yet.
Our previously suggested oil short via SCO continues to do very well. On Friday, we suggested taking profits, or at the very least moving your protective stops way up in SCO to protect some nice short-term gains there. For those of you who stuck with the trade, just continue to move your protective stops up in an effort to ensure nice gains there.
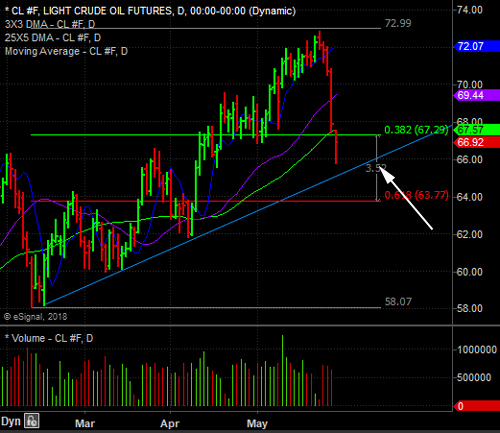
Provided below is a daily chart of the price of crude. As you can see, we've incorporated some short-term retracement levels, as well as what appears to be a key developing trend line (blue line).
The bottom line is considering the price of crude has already breached the first line retracement level you see here, and is very close to finding its way to the trend line you see here, it's probably a good idea to take the profits now in anticipation of a reversal rally back to the upside any day now.
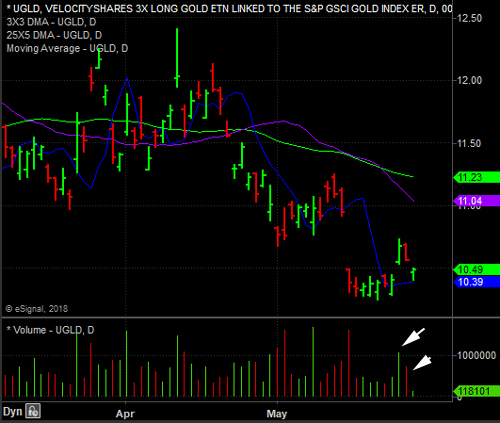
Our recent bullish gold trade via UGLD, the primary bullish leveraged ETF tracking the price of gold, has pulled back following our suggested entry just last Thursday. Nothing alarming at this point, as you can see Friday's sell-side volume on this chart of UGLD wasn't as high as Thursday's bullish volume.
Still, we'll need to now see gold rally soon if the trade is going to pan out - no pun intended. The bottom line is we'll continue to employ a protective stop of $10.25 on UGLD until the ETF either rallies, or achieves that level to the downside.
ETF Trading Updates:
Hold UGLD with a protective stop of $10.25.
Take profits in SCO, or hold it and raise your protective stop to a level you're comfortable with. Protect gains, or at the very least protect the trade from potentially turning into a losing one.
To view current open individual company picks, log-in here: https://www.vikingcrest.com/member. Note: short-term ETF trades (leveraged and non-leveraged) are only provided within the daily newsletter.
If you have any questions or would like further details regarding any of the information provided above - or anything else you're thinking about buying or selling out there - please don't hesitate to call or email your Rep . at 619-369-9316.