Dollar Reverses - S&P 500 and DOW Updated - What's a DMA?
Published on September 5, 2018 @ 9:31am
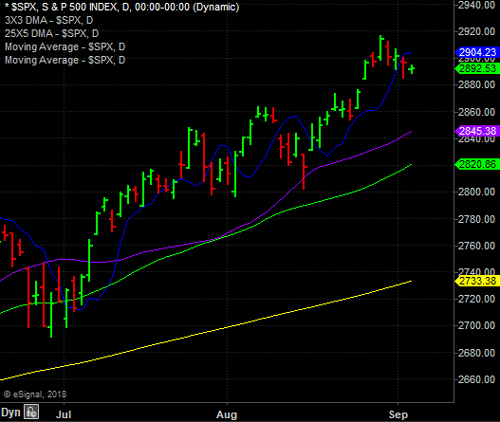
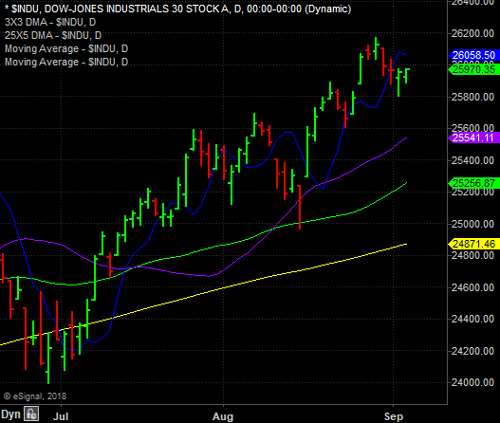
Stocks backed off for the third consecutive day in a row yesterday, but the major indices have only managed to find themselves slightly below some key displaced moving averages - the very same DMAs we like to use when predicting what lies ahead for the major indices on both a short and long-term basis. More on this in a second.
It was another fairly rough day for all of the major indices yesterday, however, if they're going to find their footing again without moving substantially lower, we should see some semblance of a reversal as soon as this week.
Provided here are daily charts of both the S&P 500 and the DOW. As you can see, both have now found their way back below their 3X3 DMAs (blue lines). Typically, when a stock or an index has been thrusting above its 3X3 DMA for weeks, it will usually come back below it for three or four days at the most, before finding its way back above it and resuming its recent bullish trend.
For those unfamiliar with DMAs, we find them far more leading in nature than their simple moving average counterparts. In short, a DMA is a simple moving average that is moved forward in time a number of days. In the case of a 3X3, it's a three day moving average moved forward three days in time - hence its name 3X3.
In the case of a 25X5, which is always the purple line we use in our charts, it's a 25 day simple moving average moved forward 5 days in time. As for the yellow line we use in our charts from time-to-time, that will always represent the simple 200-day moving average.
Considering we do still believe there's potential for more upside ahead before these markets potentially correct again, both the S&P 500 and the DOW will need to find themselves back above their 3X3 DMAs no later than the end of this week, and more importantly breach their recent highs if both are going to resume their longer-term trends higher.
Specifically, we'll need to see the S&P 500 above 2,904 and the DOW above 26,058 if both are going to suggest the strong possibility of new highs in the weeks ahead. Keep in mind, DMAs move from day-to-day, but those are the numbers as of right now.
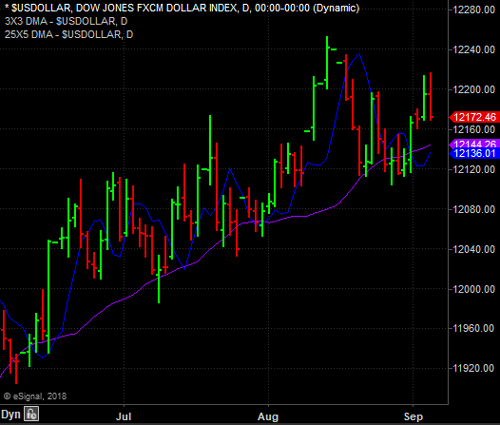
We mentioned yesterday the importance of the dollar breaking down if the current monetary environment is going to provide a favorable backdrop for stocks and commodities in the near-term. Today, we're already seeing some early weakness in the dollar following yesterday's temporary reversal back to the upside.
So far so good, however, we still need to see downside follow through on the dollar if our current open positions in oil and gold are finally going to pan out much better than what we've seen over the last few weeks.
Provided here is an updated daily chart of the US Dollar Index showing you this morning's early weakness, and as can see, it has already wiped out yesterday's strength. Now, we need to see the follow break down substantially if our open positions in UCO and UGLD are going to play out nicely.