The True State of the Economy - Rates, Consumers, Trade and S&P 500 Technical Tea Leaves
Published on September 14, 2018 @ 7:46am
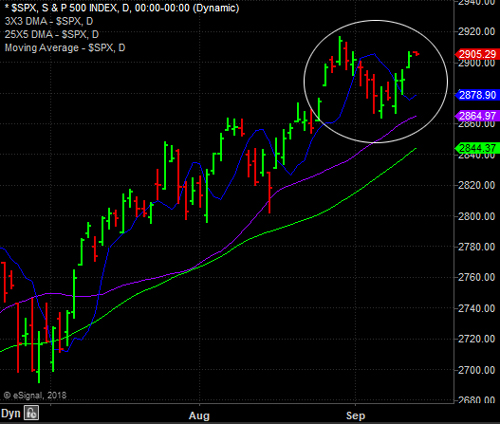
Yesterday marked the third consecutive constructive day for bulls across all of the major indices - further suggesting the markets' underlying bullish tone still remains intact. Today, however, is a fairly important day for the near-term landscape, as today could mark the fourth consecutive day the S&P 500 will have closed above the all-important 3X3 DMA we like to reference so often.
Why is that so important? We talk about this often - when a stock or an index has been thrusting above its 3X3 DMA for an extended period of time, then finds its way back below it for a reasonably short number of days, as long as it can find its way back above it and hold for at least three or four days, the ensuing move is usually to the upside.
Provided here is a daily chart of the S&P 500, along with its 3X3 DMA (displaced moving average - blue line). As you can see, we've circled the reason price action of the S&P 500. In the best interest of complete objectivity, the only concern at this point is the fact the S&P 500 recently spent five days below this key displace moving average. However, the good news is it has closed back above it now for three consecutive days.
In short, the markets are ever so close to confirming the ongoing bullish trend, or are on the verge of entering a new short-term bearish trend. However, the longer it stays above its 3X3 DMA, which currently sits at 2,878, the more and more context there will be for another market breakout to the upside soon. The inverse of that would be it finds its way back below it over the next few days, which would not be good for the near-term market landscape.
From purely a technical charting perspective, the bottom line is it's our opinion the markets are on the verge of resuming their long-term bullish pattern higher soon.

On the economic front, we did get some interesting data this morning worth pointing out. First, on a year-over-year basis, export prices rose 3.6% compared to analysts' expectations of 2.5%. That's a huge beat considering this has been one of the Trump Administration's major agenda items for months now. Secondly, on a year-over-year basis, import prices only rose 3.7% compared to analysts' expectations of 4.6%. That's also another huge beat considering all of the negative rhetoric regarding tariff concerns.
Further, Industrial Production also saw a .4% rise this month over last month when analysts were expecting a .3% rise. The bottom line is the data does suggest we're starting to see a better import/export pricing balance, which should help the long-term health of industrial manufacturing and production here in the US.
Lastly, on the consumer front, ex autos, retail sales came in lower than expected - with a .3% rise on a month-over-month basis - when analysts were expecting a rise of .5%. However, preliminary consumer sentiment came in at 100.8 vs. 96.1 - the second highest of the year and the second strongest since 2004.
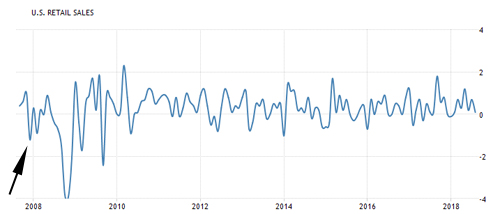
With that, we did decided to take a historical look at retail sales dating back to the top of the market in 2007 - just one year before the major crash of 2008. As you can see below, retail sales have been in a consistent range for the good part of about eight years now. However, when you go all the way back to 2007, there was an early sign back in late 2007 that did suggest potential trouble brewing for the economy, and specifically the consumer. We've pointed to that early sign here.
The takeaway today is simple. Everything on the economic front continues to appear very orderly for the time being - further suggesting no problems surfacing yet. The current technical landscape of all of the major indices also doesn't suggest any sort of developing problems yet. But, if and when we see a significant drop off in retail sales, that could end up triggering a red flag for things to come.
Until then, or until something glaringly negative surfaces fundamentally or negatively, these markets still have every right to move higher for the time being.

When it comes to interest rate concerns, we still think that is the biggest joke of all. Remember earlier in the year, when the financial media started spewing concerns on the interest rate front? We were among the very few out there that continued to suggest rates will not, and more importantly should not, become a concern then or anytime soon. We're still 100% convinced of that to be the case.
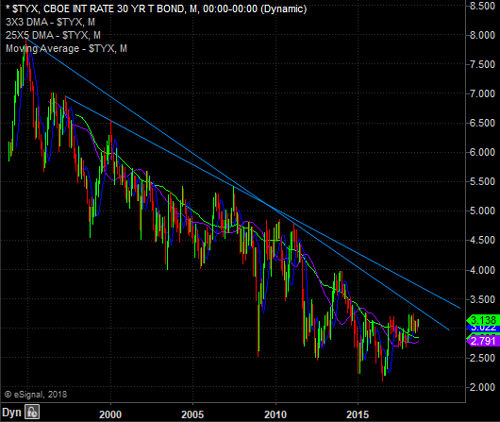
Why? It's been a while since we provided this one very defining chart when it comes to interest rates - the 30-year treasury yield dating all the way back to 1993. See the pattern? See the trend lines? We're still clearly in a long-term downtrend, and even if rates were to rise substantially over the next few years, it won't end up being the markets' demise. Sure, there could be other reasons for a developing bear market at some point, but it won't be because of rates.

Rates continue to remain down around substantial historical lows, and considering we've had a number of bull and bear markets within dramatically higher interest rate environments over the last 25 years, we still don't think rates will end up being the real reason the next bear market will develop - whenever that comes.
Sure, corporate debt could end up becoming a significant concern at some point, as companies have spent way too much buying back stock and paying out dividends, rather than organically growing their businesses. However, the blame shouldn't end up being rising rates, as much as it would clearly end up being just irresponsible decision making by corporate America management, and overly aggressive monetary policy from the FOMC for almost ten years now.
You can kick the can down the road, but for how long? That's the game of chicken these markets will continue to play until a point in time they find a different reason to blame for the next bear market to come.
