Markets Get the McGregor Smack Down - For Now
Published on October 8, 2018 @ 8:28am
The broad-based selloff continued Friday, but it does appear to be fighting back so far on the morning today. Other than utilities and some already beaten down real estate ETFs, there's literally been nothing out there insulated from the recent reversal across all of the major indices.
Although most names out there have taken a pretty good beating over the last few days, the good news is we've seen this before, only to have the markets come roaring back every single time. Will this time be any different? We don't think so - not yet anyway.
Everything continues to take a hit on a short-term basis, but definitely not as bad as many other well-recognized quality names out there. Basically, nothing typically impacts individual names on a short-term basis more than the broader markets' sentiment. Meaning, if the markets are breaking up or breaking down on a short-term basis, most individual names are going to follow suit, and the last few days have been no exception.
However, our strategy change back in August - to opt for more undervalued growth opportunities that have already been beaten up on a long-term basis - does continue to at least provide a little more insulation right now than what we're seeing with most other names out there.
As for what's taking place from a macro perspective right now, the financial media has once again brought the rising interest rate argument back again, which has been a very consistent theme for years. Meaning, every time the markets decide to sell-off, they blame rates.
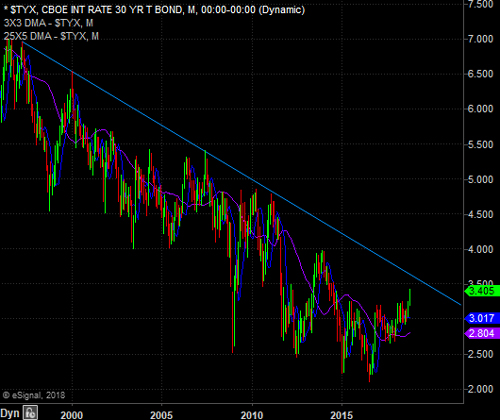
Case in point, back in early February, and then again in mid-March, they blamed rates for the selloff. This has happened on several other occasions over the last several years, and every time I provide everyone with the same chart, a long-term monthly chart of the 30-Year Treasury Yield dating back to the early 90's.
Well, here it is again, albeit updated. As you can see, interest rates have been in a very dramatic long-term decline ever since the early 90's, and when you consider the long-term trend line of that decline throughout the entire time period, it does not appear anything is about to change anytime soon.
The bottom line is the media has to blame something other than what's actually taking place at the time. In other words, what's taking place this time around is more of a concern regarding current valuations and some mid-term election jitters. However, neither seem to be more important than the fact these markets have had a habit of shaking investors' confidence, before moving on to new highs again.
That's been the theme for years, and until something technically suggests otherwise to us, we're still convinced there's more upside on a long-term basis. Provided here are two charts of the NASDAQ Composite - a weekly and a monthly.
When you step back and assess the markets' long-term landscape, you can see on the weekly chart here the index has made this very same move on a few other occasions this year. Specifically, back in early February, mid-March, and then again in mid-June.
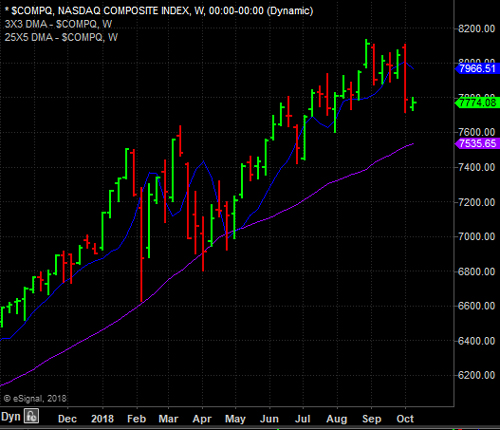
Although last week marked only the third time this year the index has found its way substantially back below its 3X3 DMA (blue line), the monthly chart still suggests the long-term bull market is still fully intact.
As a matter of strong opinion, the NASDAQ could find its way back to its 3X3 DMA (blue line) on the monthly chart here, which would put the index down around 7,540, and the long-term bullish thrusting pattern would still be intact.
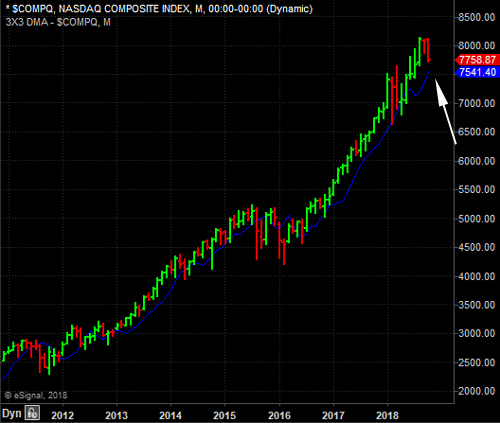
We'll simply continue to sit tight for the time being, and look to potentially take advantage of the recent volatility if and when the NASDAQ breaches 7,600 to the downside. If that doesn't happen, and the markets simply find their footing well before that level, we'll stick with what we've got for the time being, and continue to exercise a little patience.