Markets Work to Bottom - GDP No Biggie - Dollar at Critical Pivot Point - FAANG Analysis
Published on October 26, 2018 @ 7:18am
FREE ARTICLE - TRY THE REAL THING FREE FOR TWO WEEKS - NO CREDIT CARD REQUIRED: https://www.vikingcrest.com/register
It's clearly been Mr. Toad's Wild Ride this week, but we're finally convinced these markets are in the "process of developing" a bottom on at least a short-term basis. Both GOOGL and AMZN provided investors with stellar earnings reports post-close yesterday, but both sold off substantially in after-hours, and are following through this morning.
So why selloff when both companies absolutely crushed analysts' estimates? Because right now it's not about this quarter and next quarter earnings, it's far more about the softening growth curve that's expected to take place across the entire tech space heading into 2019.
Additionally, although all of the FAANG stocks are clearly offering much lower levels now, our technical analysis is still suggesting potentially lower levels ahead for GOOGL, FB and NFLX, while AAPL and AMZN look to be the better of the five. That's purely from a technical perspective right now.
In other words, we can finally make bullish technical arguments for AMZN and AAPL on at least a short-term basis, while we'd stay away from any short-term trades in the other three. Sure, all of them are probably set to rally sooner, rather than later, but it's only AAPL and AMZN we'd suggest speculating on from current levels. At least that's the way it's looking right now.
Although we do believe GOOGL could offer the most growth over the next several years, its short-term technical landscape continues to suggest it may find its way down below $1,000 per share, before it might be in a position to offer significant upside.
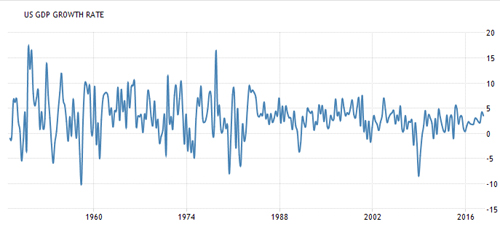
On the fundamental front, it's not about the economy. We got some GDP data this morning, and the US economy advanced an annualized 3.5% for the third quarter of 2018, beating market expectations of 3.3%. That follows 4.2% growth in the previous period, which was the highest since the third quarter of 2014.
Consumer spending rose faster and inventories rebounded. On the other hand, investment in structures fell the most in near three years, while residential continued to contract, and net trade made the biggest drag on growth since Q2 1985.
We love long-term charts, so provided here is a historical chart of GDP dating back to forever ago, and as you can see, GDP isn't anything to brag about, or lose sleep over at this point. Meaning, it's good, but not historically great.
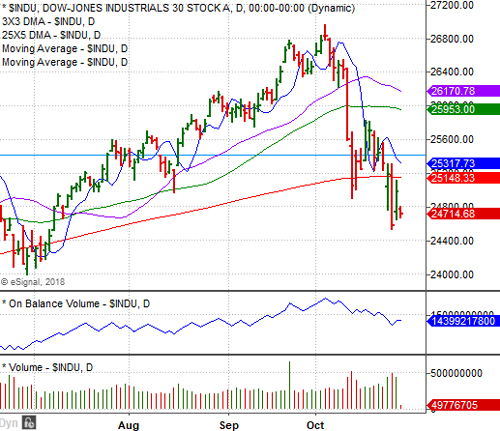
The bigger issue is earnings, and the projected softening many companies are likely to experience at least through the first half of 2019, so we're seeing a bit of a valuation adjustment type re-set in equities - in anticipation of the first half of next year. Basically, it appears the markets are preparing for the worst, and hoping for the best.
From purely a technical perspective right now, the major indices still have yet to stage that big wash and rinse move we referenced in yesterday's edition. Meaning, a massive move down followed by a furious snapback into the close. Maybe that's today, maybe not. However, the last few hours of trading today should be a big tell.
Interestingly enough, back in February the major indices staged their bottoms on February 9th, which was on a Friday, so we'll see how things shape up into today's close. No guarantees, but it's a potential technical event seriously worth watching for.
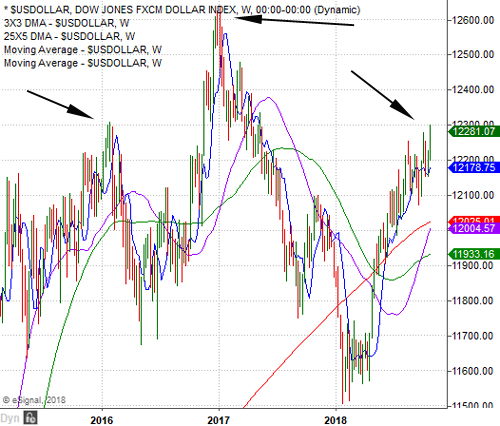
As for the dollar and commodities, the dollar is not encouraging right now. It's recent rally is crushing oil, along with slowing manufacturing and production concerns. It's also creating concerns for US exports, and those companies who derive much of their revenue from abroad.
Precious metals don't seem to care about the dollar, as investors are fleeing equities in lieu of hard assets like precious metals. Trust me when I say though, if the dollar doesn't break down as soon as next week, and the markets start to rally, there's a high likelihood precious metals will back off again. However, there's still a very big possibility the dollar could start selling off soon.
Here's a weekly chart of the US Dollar Index going all the way back to 2015, and as you can see, we've pointed to what may end up being a strong developing head and shoulders pattern on a long-term basis. The left shoulder, the top, and then the right shoulder. Assuming the dollar breaks down as soon as next week, it's going to dramatically change the entire market landscape in the weeks ahead.
However, until it's proven, it's not a good idea to assume anything at this point. We'll just have to see how things play out, but be rest assured you'll be among the first to know.