Stop the Games and Learn to Trade with Real Analysis - A Perfect Example Here
Published on March 26, 2021 @ 7:06am
NASDAQ bounces on cue off the 12,800 level. More follow through to roughly 13,200 is in order now. If we can't hold 12,800, then the 12,200 - 12,000 level is in the cards. Our suggested bullish oil trade yesterday is working - here's an update on the trade, and where oil should be headed on a very short-term basis. Update on rates and the potential opportunity that may be finally starting to surface in bond ETFs like TLT and EDV.
Markets Bounce On Cue - All Major Index ETFs Updated - Oil Trade Update - Bond ETFs and Rates
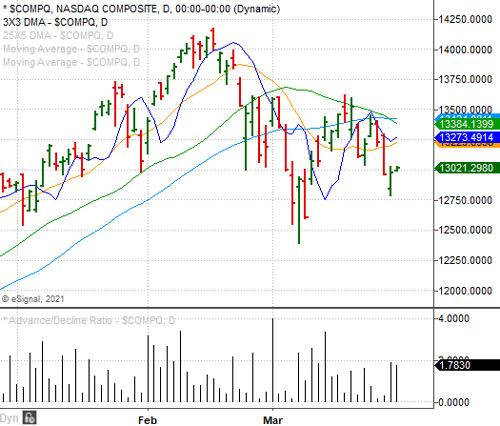
It was another constructive day for the broader markets yesterday, as all of the major indexes bounced sharply off their recent lows. Specifically, the NASDAQ Composite ran down to that 12,800 level I referenced in yesterday's morning's newsletter, and bounced nicely off that level. Provided here is a daily chart of the Composite showing you what I'm referring to.
Although it did give up some gains by EOD, it's still in a position to move higher from here. Meaning, assuming the 12,800 level holds today, we're likely looking at a move to roughly 13,200 before we'll know if there's even more upside ahead or not. If it can't hold that 12,800 level though, then I'm 100% certain we're headed for anywhere between 12,255 - 12,000.
What does this all equate to for the primary ETFs tracking the major indexes in QQQ, SPY, IWM and DIA? Assuming that 12,800 level holds, and more importantly these markets continue higher from here, the next logical resistance level for the NASDAQ 100 ETF QQQ should be anywhere between $314 and $319. For the S&P 500 tracking SPY it's $392 - $395. For the Russell 2000 tracking IWM it's $220 - $225. And for the DOW tracking DIA it's $328 - $330.
In short, if you got long any of the Index tracking ETFs when the NASDAQ achieved 12,800 level yesterday, you're in a good position for now - just make sure to take the profits when they're there, because in the event those above mentioned levels end up being achieved, index traders may want to consider flipping back to the short side of the trade. Then, let things work from there, but be sure to use protective stops slightly above those levels mentioned above.
All in all these markets continue to behave efficiently. Meaning, all of the levels we continue to reference continue to play out accordingly, but it's important to make sure you're properly managing those index trades in an effort to mitigate as much risk as possible, because we all know what these markets are capable of from day-to-day.
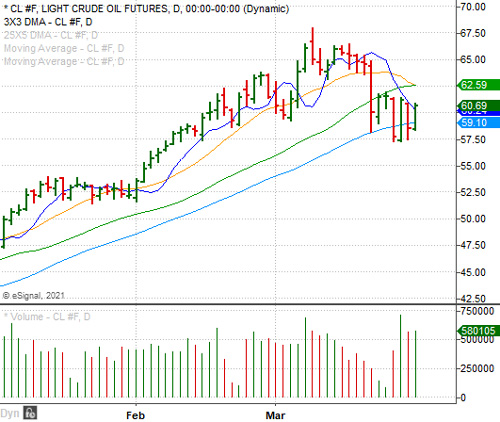
As for our suggested bullish oil trade yesterday, GUSH did well but UCO was pretty lackluster. Now, it becomes all about the $61 - $62 price level on the price of WTI Crude. In other words, assuming GUSH and/or UCO continue higher from current levels, it will be around the $61 - $62 level on WTI Crude traders may want to take profits in GUSH and/or UCO. Just make sure to trail your gains with stops in an effort to protect those gains, while giving either room to work toward that oil target I just mentioned.
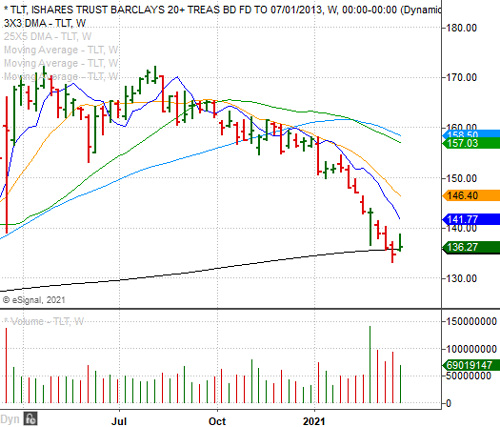
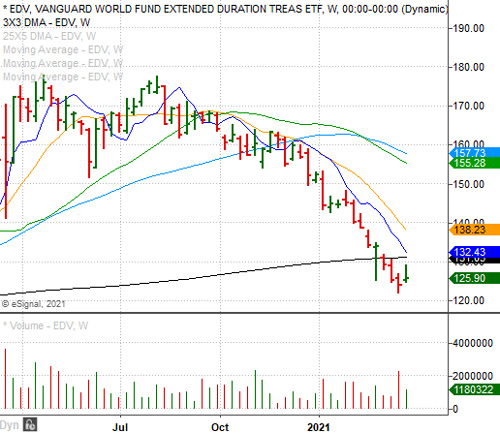
On the interest rate front, those bond ETFs we've used from time-to-time over the years are finally starting to look attractive again. Why? Interest rates may be on the verge of falling again, and those bond ETFs in TLT and EDV are starting to trade much better around their 200-Week SMAs. TLT is the primary ETF tracking the 30+ Year Treasury Bonds, while EDV seeks to track the performance of an index of extended-duration zero-coupon U.S. Treasury securities.
Basically, when rates go up bonds go down and vice versa. And, based on what we're seeing in recent days with rates and bonds, it does look like bonds are trying to confirm a pretty significant technical reversal, while rates may be in the early stages of another downtrend. Provided here are weekly charts of TLT and EDV, and as you can see both are down around their 200-Week SMAs (black curved lines).
Although a few days do not make a new trend, we're going to keep a close eye on these ETFs in the event we get some sort of strong confirmation of a reversal. If that ends up being the case, we may suggest entering into TLT and EDV on a bit of a mid-term basis. Meaning, a way to capture some modest gains in the event stocks can't find their footing over the next week or so.
For now, there's nothing wrong with hedging a bit with TLT and/or EDV. We just need to be careful in the event the recent strength in those ETFs over the last few days are nothing more than a very short-term bullish head fake.
Current Stance for Equities:
Create a Free Trial Here To See Our Current Stance for Equities: https://www.vikingcrest.com/register
Suggested Long-Term ETF Holdings:
Create a Free Trial Here To See Which ETFs We Continue to Suggest Investors Maintain Exposure To: https://www.vikingcrest.com/register
Individual Company Ideas:
Create a Free Trial Here To See Which Stocks We've Recently Suggested: https://www.vikingcrest.com/register
Important Strategy Tips On Trading, Investing, Portfolio Management and Using Our Service
Very important for any trader and investor who wants to be successful. To review a list of rules and disciplines to consider go here: https://www.vikingcrest.com/article/88. It's a good idea to review this article from time-to-time for any newly added rules.
To view our current trading ideas log-in here: https://www.vikingcrest.com/member. If you have any questions regarding a specific stock - even if it's something we haven't suggested - you can reply directly to this email, or call us at 619-369-9316.
John Monroe - Senior Editor and Analyst