Client Newsletter Example: More On Why Stocks Do What They Do - Levels to Consider On QQQ, SPY, IWM, DIA, Ethereum and Bitcoin
Published on May 14, 2021 @ 7:11am
I hope today's newsletter changes your perception of these markets, and how individual stocks do what they do, forever. A constructive day yesterday met with some bullish follow through this morning. However, we expect big swings in both directions over the next several days before these markets figure themselves out. Here's why, how market makers and desk traders work, and specific levels on QQQ, SPY, IWM and DIA for index traders to position long or short - all in an effort to reduce risk, while maximizing returns. Bitcoin and Ethereum have been under pressure in recent days - traders/investors need to be careful. Here's next level possibilities for both that would offer the best buying opportunities with the least amount of risk.
More On Why Stocks Do What They Do - Levels to Consider On QQQ, SPY, IWM, DIA, Ethereum and Bitcoin
Before I get into some very specific levels for index traders to work with on QQQ, SPY, IWM and DIA, as well as more attractive levels for Bitcoin and Ethereum, I want to share with you today how and why stocks do what they do - no matter how good or bad the fundamentals of the company in question really are. I've alluded to some of this lately, but we'll take a deeper dive today. It's going to take a few minutes here, but this is exactly how investors/traders should view these markets, and all of the stocks associated with them...
Ever wondered why a stock just keeps screaming higher or lower with no real fundamental reason for doing so? Meaning, why would a great company's stock collapse for no apparent reason, or a terrible company's stock would keep screaming higher for no apparent reason? Ever wondered why your protective stop is taken out just before a stock or ETF turns around and goes higher? Ever wondered why a stock can get so hot only to become so not? How about a stock that completely disconnects from a very attractive fundamental landscape?
First, we say it all of the time... in the end fundamentals will always win, which is why long-term investors should only ever focus on what stocks are worth, and more importantly stick with only those companies that are fundamentally proving themselves over and over again. However, when it comes to short to mid-term trading anything, it really doesn't have half as much to do with the above as it does the inventory of the stock at the time one is trading it, and more importantly what desk traders and market makers are doing with that stock.
In other words, on behalf of their biggest clients, it's a desk trader or market maker's job to hunt for volume, shake out weak hands, get stock on the cheap, and ultimately sell that stock into strength. Look at it like this... you go to the farmers' market, and everyone is yelling and screaming for you to buy their produce. They're advertising it with shiny signs, and making their produce look as pretty as possible. Some are selling their produce on the cheap, but for good reason - their produce just isn't very good.
Some are more expensive than others, because their produce is simply that much better, while others are willing to sell theirs for virtually nothing because maybe it's smaller and just doesn't taste that good. On great days, the market is lively and full of customers, while other days, the crowds are small and demand just isn't all that high.
Meaning, when the crowds are big everyone is willing to outbid each other, but when the crowds are small the farmers are a bit nervous, and are willing to reduce the price of their produce for fear they can't get rid of it. There's even those time periods when the farmers' crops were light or overly abundant, as well as time periods when the customers are worried about having too much or too little food on the table. All of it has an effect on the supply, demand and prices for the produce in question.
So what does this all have to do with market makers and desk traders? On behalf of their biggest clients, they have the product. They do the advertising, they have the shiny signs, they know how much produce they have, and they're the ones that are going to figure out a way to sell as much produce as possible because that's how they make money - by generating volume. They're going to try and sell that volume for as much as they can until nobody is willing to pay those prices anymore, or until there is no produce left to sell.
With that image in mind, the above is why we'll never ever suggest penny stocks. The very large majority of any penny stock is typically controlled by only a few, or sometimes just one. Meaning, you are at the mercy of somebody who owns the majority of that stock. And because of that, they can price manipulate it, move it up or down at will, and even paint a beautiful chart - advertising their cheap produce at higher prices. Then, unknowing investors come piling into that stock, only because someone has made it look really shiny.
Then, there's everything from those promising small caps to the most darling mega caps that consist of some of the greatest companies on the planet. Even then, however, the game is somewhat the same. Desk traders and market makers are going to work that stock in a way that generates the most volume at the highest prices, get that same stock cheap again, and then depending on the technical/fundamental landscape, bring it back at higher prices, or let it fall into oblivion because it was clearly never worth anything close to what they sold it at.
However, when it comes to those promising small caps and darling mega caps, you have very savvy and intelligent customers who are only willing to pay a certain price anymore before they'll say it's just too expensive. You also have very large funds and institutions that are going to put their money to work in the right names for the long haul, never touching it for years and years, because they know the company they've invested in is going to do very good things in the years to come.
What I'm getting out here is desk traders and market makers are always looking for volume. However, we use a number of the same tools they do showing us where volume support is, where volume resistance is, and ultimately use our fundamental analysis in an effort to bring you profitable ideas year in and year out. Still, when desk traders and market makers can't find the volume, they'll take something as high or as low as they can until they either find buyers, sellers, support or resistance.
This is why you will see a stock run to the moon on air or fall into oblivion despite being a fundamentally great company etc.. In other words, it's ALL ABOUT PRICE AND VOLUME ACCEPTANCE. Meaning, when desk traders and market makers can no longer find volume at a certain level, they'll take it back the other way and vice versa - until a point in time they find price and volume acceptance at hopefully the highest possible price.
However, there are even other very obscure nuances that can impact even the greatest of companies' stocks. Case in point, when you have a stock, let's say Disney or Advanced Micro Devices, that big funds and institutions have large holdings in, desk traders and market makers know this. Meaning, they know the large majority of that stock isn't going to be sold.
This creates an opportunity for them to push the stock around all over the place, because there's actually not that much stock floating around for sale in the retail community day in and day out. The less stock that's out there with the least amount of price acceptance, the more they're going to push it around, and that's precisely what's been happening to these markets lately.
So how do you/we deal with all of it, and more importantly take advantage of all of it? For a day-trader or swing trader, it's very important to know where the price acceptance is, where it isn't, and knowing where the institutional support/resistance is. If you know this, you have an edge 99% of the retail trading/investing community does not.
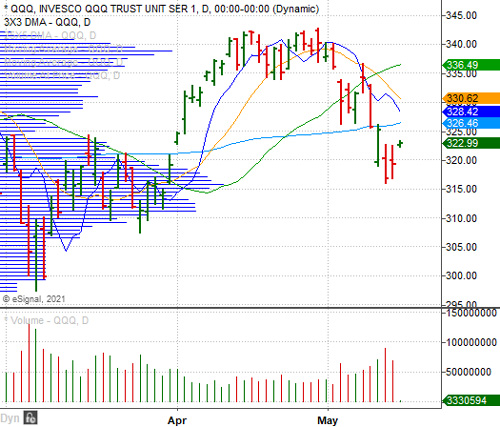
With that, I've provided images below of a few tools I use internally toward determining everything I just mentioned above. I'm not going to get into all of the details regarding how they're used today - just know this is a large part of my technical toolbox. First is a daily chart of QQQ, along with all of my preferred moving averages and volume at price. The latter shows you where the most volume is at a certain price. Are these the only technical indicators I use when charting? No, but these are some of the more important ones.
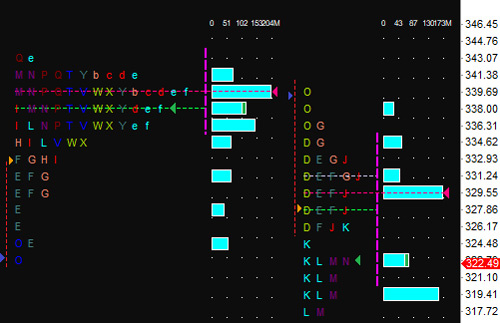
The second image below is a "Market Profile" for QQQ. This may look like Chinese to most, but this shows me particularly where the support/resistance for a stock really is - all the way down to the penny. Is it the end all be all for identifying what's going to happen with a stock? Absolutely not, but it is a tool that can give anyone a tremendous edge.
The bottom line is when we consider all of the above, there are certain price levels for certain instruments right now that would offer lower risk higher probability entries to the long or short side for QQQ, SPY, IWM and DIA, the four ETFs tracking the NASDAQ 100, S&P 500, Russell 2000 and DOW respectively.
Specifically, the next big levels of resistance for QQQ sit between $329.55 and $339.69. For SPY, it's between $413.70 and $417.90. For IWM, it's between $223.02 and $224.91. And for DIA, it's simply $342.21. Meaning, any sharp break above those latter levels and these markets should move sharply higher - assuming of course there's price acceptance above those levels.
However, they'll first have to deal with those lower resistance levels, as desk traders and market makers will put pressure on those instruments around the lower price points - just to see how much buy-side volume acceptance there really is. In other words, those interested in shorting the index ETFs should use just shy of those above mentioned levels for your entries.
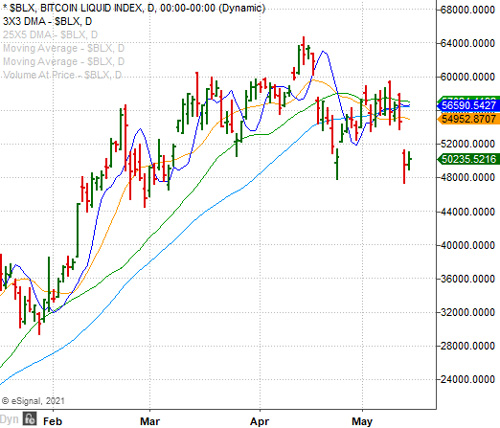
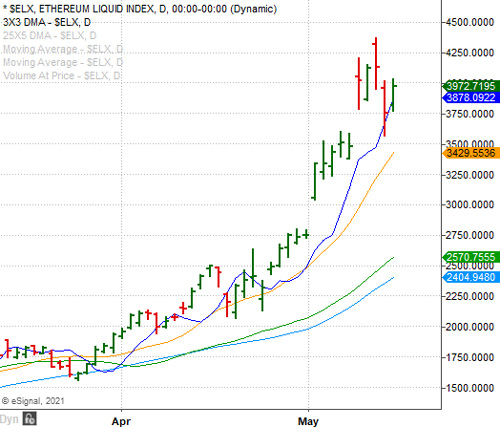
Also provided here are daily charts of the Ethereum Liquid Index and the Bitcoin Liquid Index, which have been under quite a bit of pressure over the last few days. In short, if either can't find their footing very soon, Bitcoin could be headed for 48,039, and if that doesn't hold then 34,633. As for Ethereum, if it can't hold 3,389, it could be headed for 2,314. Although literally anything is possible on either of these instruments, I would use those levels to work with when trading either.
As we wrap up the trading week, I just wanted to share all of the above in an effort to help educate everyone on how and why these markets do what they do, and more importantly why individual stocks do what they do. I know there's a lot of free information out there every single day of the week, but it's important to remember all of the above, because more often than not, it's all of that free information that's doing nothing more than advertising shiny objects at the farmers' markets.
I hope you found today's edition more informative than anything else you'll read in the weeks and months ahead. I'm a firm believer that while we're always working to give you the fish that you find just as much value in the fact we're always trying to teach everyone how to fish along the way.
Current Stance for Equities:
Create a Free Trial Here To See Our Current Stance for Equities: https://www.vikingcrest.com/register
Suggested Long-Term ETF Holdings:
Create a Free Trial Here To See Which ETFs We Continue to Suggest Investors Maintain Exposure To: https://www.vikingcrest.com/register
Individual Company Ideas:
Create a Free Trial Here To See Which Stocks We've Recently Suggested: https://www.vikingcrest.com/register
Important Strategy Tips On Trading, Investing, Portfolio Management and Using Our Service
Very important for any trader and investor who wants to be successful. To review a list of rules and disciplines to consider go here: https://www.vikingcrest.com/article/88. It's a good idea to review this article from time-to-time for any newly added rules.
To view our current trading ideas log-in here: https://www.vikingcrest.com/member. If you have any questions regarding a specific stock - even if it's something we haven't suggested - you can reply directly to this email, or call us at 619-369-9316.
John Monroe - Senior Editor and Analyst