Client Newsletter Example: Indexes Move Back Up to Key Short-Term Moving Averages - More Short-Term Trading Assistance
Published on December 22, 2021 @ 8:08am
Major Indexes move back up to key short-term moving averages. Still more damage to mend if these markets are going to make new all-time highs, without first achieving those previously published downside targets. Also, more assistance on how to take advantage of the very short-term swings on those hourly charts I pointed to on Monday.
Indexes Move Back Up to Key Short-Term Moving Averages - More Short-Term Trading Assistance
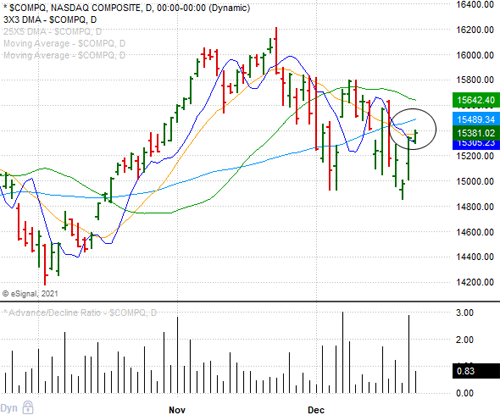
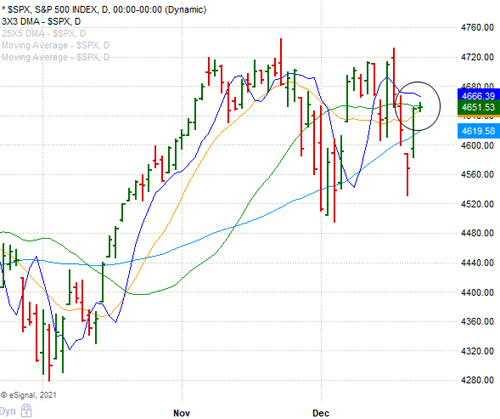
It was a very good day for equities yesterday after all of the Major Indexes achieved key downside moving averages on their weekly charts on Monday. However, there's still a lot more damage to repair if these markets are going to suggest new all-time highs, without first achieving those levels I pointed to on Monday. Specifically, 14,793 on the NASDAQ Composite and just above 4,400 on the S&P 500.
Provided here are daily charts of both, and as you can see all they've managed to do at this point is find their way back up close to their 14-Day SMAs (orange curved lines) and 3X3 DMAs (dark blue curved lines). Now, we find out if we're simply going to blow through those levels, or if we're going to pull back yet again.
Considering the strength of yesterday's move and all of the volatility that has surfaced lately, it would be no surprise to see these markets give a little bit of that back as soon as today. That would not be a big deal. What would be a big deal, however, is a complete reversal back to the downside, because if that ends up happening then we're most certainly looking at those above-mentioned downside targets. So for now, it's probably going to be all about the next two trading days, which tomorrow ends the trading week.
The bottom line is we're having a tough time pulling the trigger on adding any new long-term ideas to any of our open lists right now. Although I firmly believe these markets are going to make new all-time highs at some point this year or next, it's all about whether or not we're going to end up going lower first. This is why right now it's a heck of a lot easier to just trade the very short-term back and forth price action in those high quality names and ETFs.
With that, I provided a quick tutorial on Monday regarding how to trade those very short-term hourly charts, so I want to add to that today. On Monday I used QQQ, the primary ETF tracking the NASDAQ 100. However, today we're going to go ahead and use SPY, the primary ETF tracking the S&P 500. Why? The S&P 500 has actually been the best performing index since these markets bottomed again back in early October.
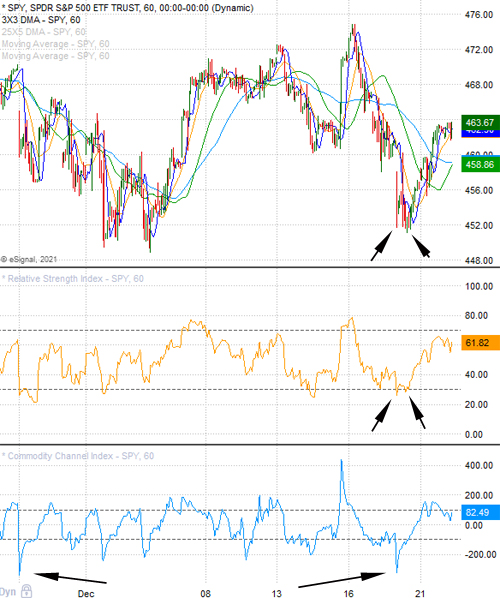
Provided here is an hourly chart of SPY dating back to the beginning of November, along with those same tools I pointed your attention to on Monday - relative strength index (RSI) and commodity channel index (CCI). As you can see, like clockwork again the ETF got way down toward the bottom end of its RSI and CCI channels on Monday, and rallied. All good, but there's a couple of things I want to show and share with you today regarding that high probability trade to the long side.
First, you can see the CCI got down to a low that had only been achieved once since late November. You can also see I've pointed to two points on the price action and two points on the RSI that suggested a very short-term bottom was in. That minor divergence on the RSI coupled with no new low on SPY also added to the probability of a quick reversal.
While we decided to trade UDOW that morning, the primary bullish leveraged ETF tracking the DOW, we did take the profits in the pre-market yesterday. Why? We weren't going to be greedy. We simply wanted to capture the first move higher, rather than sit there and try and speculate on whether or not it was going to reverse itself yet again and move lower during its middle move - the move that follows an instrument's first move.
This is important, because greed in this market isn't necessarily a good thing yet - especially when you consider these markets have been in a downtrend for a few weeks now. This is why it's also important that we consider the mid-term landscape - even when trading something as short-term as an hourly chart. Based on the markets' recent weakness, we had to be careful giving back the first move's gains, because there's literally no other place on the planet where hindsight is 20/20 more than the stock market.
Sure, UDOW moved even higher than where we took the profits, but I didn't care. We simply decided ahead of time that we would capture the early move, and then see what happens. Why? I say it all of the time - if you want the least amount of risk with the highest amount of reward, it's best to trade the extremes. Meaning, short the extreme highs and buy the extreme lows. Although pegging absolute tops and bottoms on daily, weekly and monthly charts are often a very daunting task, it's a lot easier to do with an hourly chart.
You still have to give your idea enough wiggle room on your hourly charts, but if you exercise discipline and use stops you're comfortable with, you should be able to be a lot more consistently successful with all of the above. Additionally, if you exercise enough patience you can always capture profits on the extreme highs by shorting something when it gets way up there on its RSI and CCI, and then of course taking the profits on the first move lower. You can always let things ride for a while as well, but you do have to use trailing stops.
Again, it's important to know what the macro trend is suggesting at the time in order to have a feel for what's to come on an hourly chart over the course of a few days, but if you use this "extreme context trading strategy", you should be able to consistently generate short-term profits. You probably won't capture the entire move on either side of the trade, but that really doesn't matter. As long as your account grows with little risk, you're a winner.
Like I said on Monday, things are changing so fast from one day to the next that it's not realistic for those very short-term hourly chart traders to wait for what I say here. More importantly, I'd much rather show you how to do these things on your own, because it's a lot more gratifying when you are making these types of quick decisions on your own. And, I actually get a lot more gratification in knowing I've taught someone how to do something that they didn't know how to do before.
At the end of the day, it's your money, so I believe wholeheartedly that it's far more important to continue to teach those with a desire to learn, rather than just give someone the fish. Yes, we're always going to put our best foot forward when it comes to finding great long-term investing ideas, but I do feel a huge obligation to continue to teach all along the way.
Current Stance for Equities:
Create a Free Trial Here To See Our Current Stance for Equities: https://www.vikingcrest.com/register
Suggested Long-Term ETF Holdings:
Create a Free Trial Here To See Which ETFs We Continue to Suggest Investors Maintain Exposure To: https://www.vikingcrest.com/register
Individual Company Ideas:
Create a Free Trial Here To See Which Stocks We've Recently Suggested: https://www.vikingcrest.com/register
Important Strategy Tips On Trading, Investing, Portfolio Management and Using Our Service
Very important for any trader and investor who wants to be successful. To review a list of rules and disciplines to consider go here: https://www.vikingcrest.com/article/88. It's a good idea to review this article from time-to-time for any newly added rules.
To view our current trading ideas log-in here: https://www.vikingcrest.com/member. If you have any questions regarding a specific stock - even if it's something we haven't suggested - you can reply directly to this email, or call us at 619-369-9316.
John Monroe - Senior Editor and Analyst