Client Newsletter Example: It's Still Far More About Technicals These Days - Major Index ETFs and Oil's Most Important Levels
Published on March 25, 2022 @ 8:20am
It was yet another great day for equities across the board yesterday, and although we may run into some technical resistance soon enough, these markets are in a position to move sharply higher. Here's the technical reasons why, as well as a look at where the biggest resistance levels will likely be for the NASDAQ 100 and S&P 500 tracking ETFs QQQ and SPY. Also, a technical dive into WTI Crude and its most important levels toward determining the next big move for oil.
It's Still Far More About Technicals These Days - Major Index ETFs and Oil's Most Important Levels
What was not so mainstream twenty years ago has become widely mainstream now. I'm referring to technical analysis, which includes everything from charts to all of the other technical tools and data that so many retail and professional traders/investors have at their fingertips these days. With the advent of cloud based software and web based advancements with those cloud based software programs, technical analysis has literally become the single biggest driving force for anything on a short to mid-term basis.
Sure, fundamentals always win in the end, but in a world of "show me the money now Jerry", traders and investors are not only looking for quicker gains, they're expecting them. Right or wrong, that's just the way it is, so it's our job to deliver you the most accurate and timely technical analysis out there.
There's an expression in the technology world that "data doesn't lie". Well, to be perfectly honest data does lie at times - especially when it comes to the stock market. In other words, there is no one single Holy Grail when it comes to the stock market - except for the fact that in the end fundamentals always win.
Nevertheless, when we remove those outside forces like geopolitical events, natural disasters, and anything other black swan type event, the charts can often tell you what's to come before it actually ends up happening. And this is why we fixate on charts so much. Even though economic data and corporate fundamentals are always changing, it's always going to get reflected in the charts. Sometimes it's revealed before it happens, and sometimes after, but if there's one thing we can trust on a short to mid-term basis it's the charts.
Therefore, I'm going to show you (and reiterate to many of you) some of those key volume technical tools today that I don't include in every chart every day. Why? I'm still a believer in keeping things as simple as possible without ignoring the most important points. Meaning, many don't have the time to wade through what is already a longer of a newsletter than we'd like to be putting out every day. However, I've tried many times to shorten it up, but that always ends up leaving out some very important commentary and/or analysis.
Anyhow, provided here are daily charts of both the NASDAQ 100 (not the Composite) and S&P 500, along with their most important retracement levels from their all-time highs to this year's lows. As you can see, the next two most important retracement levels for the NASDAQ 100 are now right around 15,300 and just under 16,000. As for the S&P 500, its are around 4,550 and 4,670.
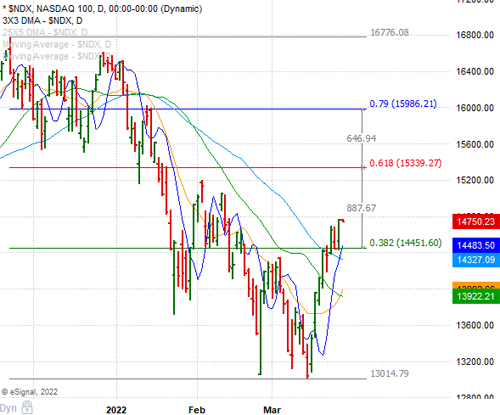
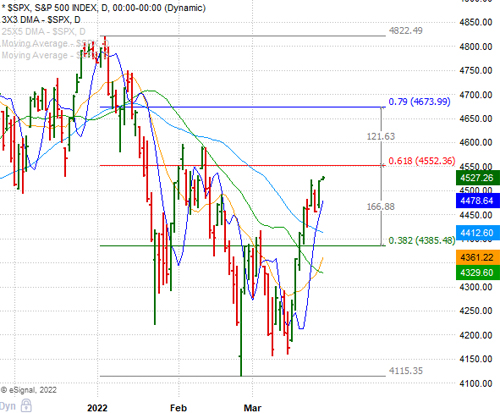
While I'm still convinced that these markets will still end up going net higher, ex of course any dramatic unexpected rise in tensions between Russia/Ukraine and/or China/US, the fact that the S&P 500 has now achieved a very important retracement level does lend itself to a pull back as soon as today or early next week. However, as long as certain key levels are not wiped out to the downside, I do think any pullback on either index is going to be met with buying.
Why? This is where I'm going to show you a few things I've shown everyone here before, but it's important to remember even these tools are not the end all be all. As a matter of fact, these tools, if used properly, are only correct about 75% of the time. Still, that's pretty good if you know how to use them, and you're only looking at very short-term day trading or swing trading, whereby you're managing trades carefully by using protective stops and taking the profits when they're there.
With that, provided here are daily charts of QQQ and SPY, the two primary ETFs tracking the NASDAQ 100 and S&P 500 respectively. I've also included the "volume at price" tool, so you can see how much volume at certain price points that both ETFs have experienced ever since topping out in early January. As you can see, there's not a whole lot of volume between where they are now and those upper retracement levels I referenced above.
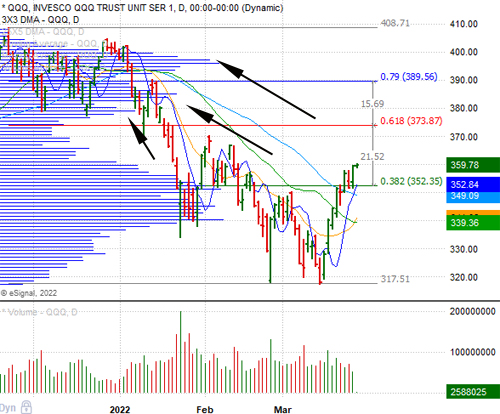
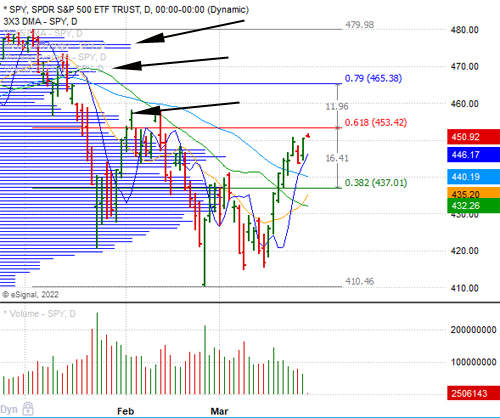
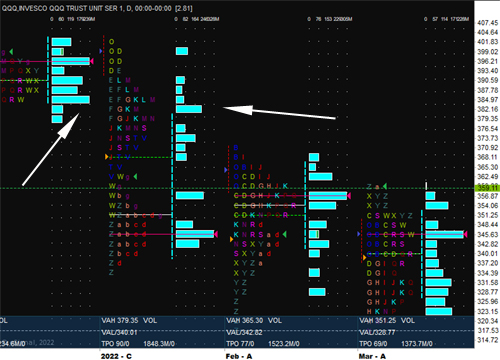
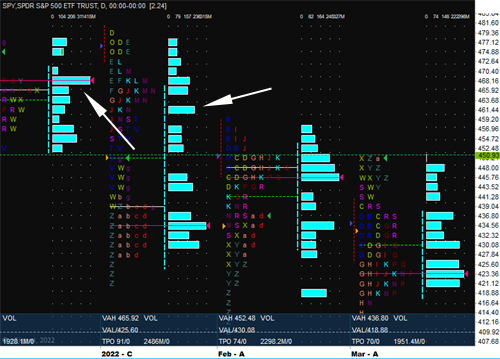
Now, I've also provided the "market profiles" for both QQQ and SPY below, which shows you similar data in a very different format. The value in market profiles is it pretty much removes time and allows one to see at what price, how much volume and how often something traded at a certain price. In other words, key support and resistance.
In the case of QQQ, you can see there isn't much between where it is now and those congestion areas that start around $385. That's quite a ways away from where it's at right now. As for SPY, it's the same up to about $461 - where you can also see the congestion starts to increase. And for those who may look at these market profiles and think it's Chinese, the more letters and the longer the lines are at a specific price, the more resistance or support that represents. That's the short answer anyway.
The bottom line is barring any majorly negative geopolitical event, it does appear these markets do want to move up to those key retracement levels, and more specifically those key resistance levels on QQQ and SPY. Then, we'll find out if these markets want to make more new all-time highs, or if we're simply going right back down again.
Additionally, and probably even more important, while so many traders and investors are basing their last decision on some media article they just read, I actually do exactly the opposite. I try to stay away from the news. Unless it's something very major that's going to change the fundamental landscape of the markets or the stock in question, I stick to the technicals and the fundamentals, because they are clearly far more true than the media's opinions will ever be.
I also want to mention if one listens to the media enough, they can become very fearful, sometimes greedy, or even depressed. And I can tell you with 100% certainty, if one is very fearful, overly greedy or depressed, it's not a good idea for that person to be trading, because if you let things like fear drive your decisions, it typically isn't going to end well. This is why we stick to charts and fundamental data, because at the point one is letting their emotions drive their decisions, it's time to step back and just read and learn until one is ready again.
Lastly, and real quick, I wanted to provide you with the same above type look for WTI Crude futures. In an effort to help oil traders here, you can see where the most important retracement levels are, as well as its most important support/resistance levels on its market profile here. Basically, $91 - $86 is where your biggest support is to the downside and $112 is your most important resistance level right now.
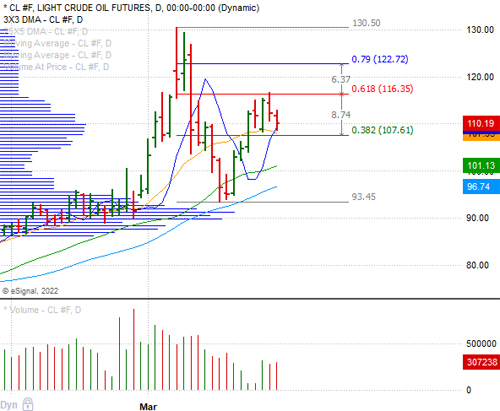
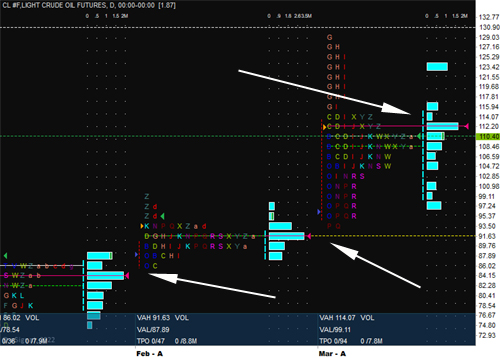
In other words, a sharp break above $112 may suggest a move back up to $116 and possibly even a move up to at least $122. However, anything to the downside could have WTI anywhere down between $91 to $86. Again, there are so many other variables that play a part when using technical analysis to discern what something is going to do on either a short, mid or long-term basis, but it's clearly far more about charts any more than it seems to be anything else.
Current Stance for Equities:
Create a Free Trial Here To See Our Current Stance for Equities: https://www.vikingcrest.com/register
Suggested Long-Term ETF Holdings:
Create a Free Trial Here To See Which ETFs We Continue to Suggest Investors Maintain Exposure To: https://www.vikingcrest.com/register
Individual Company Ideas:
Create a Free Trial Here To See Which Stocks We've Recently Suggested: https://www.vikingcrest.com/register
Important Strategy Tips On Trading, Investing, Portfolio Management and Using Our Service
Very important for any trader and investor who wants to be successful. To review a list of rules and disciplines to consider go here: https://www.vikingcrest.com/article/88. It's a good idea to review this article from time-to-time for any newly added rules.
To view our current trading ideas log-in here: https://www.vikingcrest.com/member. If you have any questions regarding a specific stock - even if it's something we haven't suggested - you can reply directly to this email, or call us at 619-369-9316.
John Monroe - Senior Editor and Analyst