Client Newsletter Example: Trader/Investor Psychology & Using Stops - Stretching Gains & Flirting with Overbought Conditions
Published on December 23, 2020 @ 10:01am
The markets, as well as all of us, continue to stretch gains, while flirting with extremely overbought conditions on all of the major indexes. How should we all manage positions? By using protective stops. However, those protective stops should vary depending on your timeframes, strategies, and more importantly your own personal tolerance for risk. Here's how to best use protective stops without having a perfectly clear crystal ball.
Stretching Gains and Flirting with the Markets' Overbought Conditions - Trader/Investor Psychology and Using Stops
While every trader/investor is always looking to achieve maximum alpha, it's never as much about the desire for alpha as much as it will always be about the risk associated with achieving it, and right now these markets have technically extended themselves to levels that will likely end up proving to be overextended within a fairly short amount of time.
It has been well documented here lately we're not all that far away from our near-term targets of $317 for QQQ and $388 for SPY. They've been the two primary index ETFs that have led these markets for years now, and that's been a good thing for most of you and us. However, it's important at this point to start questioning just how much higher these markets can go before we get a much bigger breather than anything we've seen since the early September selloff.
First, for those of you who been around long enough, you know we've been as good as anyone out there at calling the short and longer-term tops and bottoms for these markets. I warned everyone in the few months leading up to the selloff that ensued in October of 2018 and was pretty close to calling the bottom in December of the same year. We then called the breakout in October of last year, warned during the two months leading up to this year's February collapse, and then once again got pretty close to calling a perfect bottom in late March.
To be critically fair of my own technical analysis, however, I did not expect the big run that continued throughout this Summer. I strongly questioned these markets' ability to move all that much higher without first staging another big pullback, but instead they kept going until we finally got a big enough breakdown in early September to suggest a bullish reset, and thank God we continued to expose high quality names for some tremendous gains ever since.
What I'm working to say here is although stocks, and the markets in general, have a long history of moving much higher and lower than most would tend to think, I do believe we're fast approaching fairly concerning levels to suggest another looming selloff at some point soon enough.
Although nobody knows what will actually end up spooking the markets, the one thing we know is it won't be interest rates. Not yet anyway. Another thing those with experience know is that stocks go up, stocks go down, and nothing ever typically goes up in a straight line for long. Couple that with some very overbought technical conditions, and today's newsletter edition is warranted.
Further, when you consider the fact QQQ is now only 2.5% away from our near-term target and SPY is a little less than 6% away from our near-term target, it's important to know we're close enough to those targets to trigger at least a little cause for concern. Why? Because calling perfect tops and bottoms to the number are virtually impossible. As a matter of strong opinion, if one is within a few hundred points on the NASDAQ or S&P of calling a tradable top or bottom, and roughly a thousand points on the DOW, that's pretty darn good.
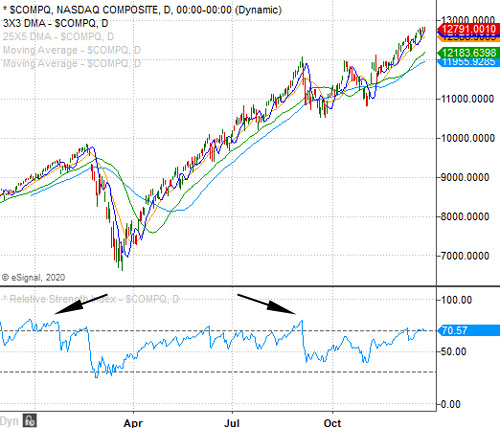
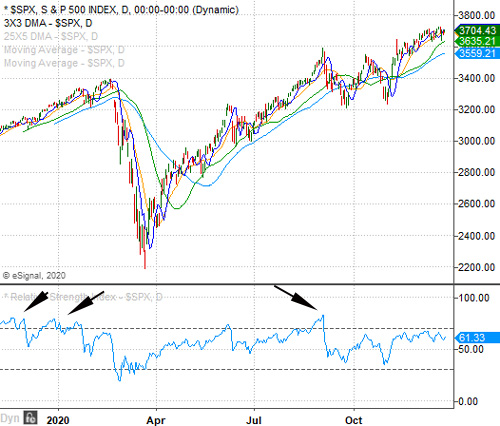
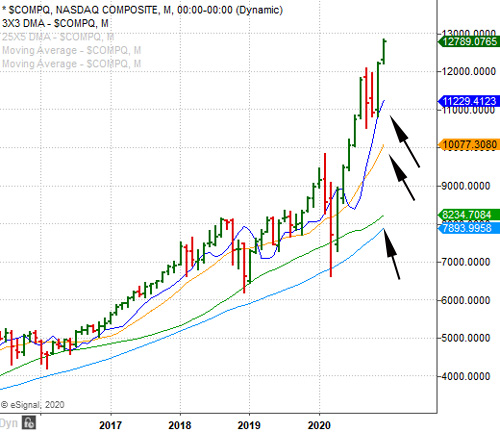
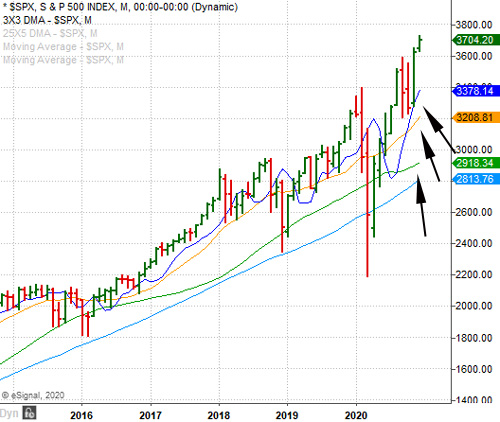
Therefore, I'll reiterate a few technical issues I've continued to reference in recent weeks, and more importantly explain how traders/investors may want to deal with things in the event these markets do decide to turn. Provided here are daily and monthly charts of both the NASDAQ Composite and S&P 500.
You can see on these daily charts the RSI levels continue to fast approach those same RSI levels that triggered both the February and September market-wide breakdowns. Again, a stock or an index can go much higher than most would tend to think, but the fact we're seeing a little divergence between those RSI levels and the bullish price action of these two indexes is a little concerning. Still, it is entirely possible those same RSI levels (or even higher) can be achieved before these markets may break down for a bit again.


When we take a step back and assess both of their monthly charts you can see things are getting stretched pretty far away from those longer-term moving averages I've pointed to here. Meaning, the further and further they get away from those moving averages, the bigger the ensuing selloff will likely end up being.


So how should traders/investors deal with all of it? While there's no question we continue to try and stretch gains from all of our current open ideas (ex SVM of course), our ongoing strategy of taking profits on the run-ups when they're there should continue to serve everyone well. Sure, some ideas will end up going higher on a short-term basis than one would have thought at times, but again nobody has the perfect crystal ball. Instead, it's all about risk management.
With that, I probably receive more questions about protective stops than anything else. Where to use them, when to employ them, and even if they're something traders/investors should trust using. The latter has everything to do with traders/investors having used protective stops before, only to have them taken out, and then watch the idea in question work its way higher.
Trust me when I say though, one person's protective stop is not going to be the target subject of market makers' as long as there's enough volume in the idea. Now if there's enough traders/investors with hundreds of thousands, or better yet millions of shares, sitting around a fairly specific protective stop level, that can be an entirely different story, which is why the old idea of support/resistance levels (when simply eyeing a chart without tools) are often take out to the upside or downside before the idea in question has a strong tendency to reverse.
In short, it's a modern day market maker tactic to clean up very large positions around old support/resistance type levels, and then reverse the idea in the other direction. Many of you here already know this happens all of the time. And, although I know many of you are very accomplished charting technicians, we've got a fairly high number of clients/subscribers who are not, but that's perfectly OK. It's part of the reason many use our analysis here from day-to-day, week-to-week and month-to-month.
So when and where should one employ a protective stop? The first thing you need to ask yourself is are you trading the idea on an intra-day basis, over the course of a few days, weeks, months or even years? That is so hyper-critical to answer first before one should ever try and employ a protective stop. Why? Again, it's not about having a perfect crystal ball - it's all about managing risk. So, you also have to ask yourself how much risk tolerance are you willing to accept in exchange for potentially higher levels?
Once you have answered that question, then you drill down into the chart timeframe in question. In other words, if you're intraday trading then it's all about those minute and hourly charts. If you're swing trading over the course of more than just a few days, then it's more about the daily charts and so on...
Lastly, the most important technical tools to effectively know when and where to place a stop have everything to do with price action, retracement/expansion levels, and then finally those key 14, 50 and 200 period moving averages for the chart timeframe in question, as well as those ever reliable exponential moving averages, or better yet those displaced moving averages we like to use so often.
It's also VERY important to keep the emotions of fear and greed out of the equation, because there's no place for the whole coulda shoulda woulda mentality when it comes to trading/investing. So, when something gets way too far away from those key moving averages on the chart timeframe in question, it's time to take the profits or employ an extremely tight stop.
If you're long an idea, and it starts to back up, then you employ a stop far enough behind the moving average you want to use depending on your risk tolerance. For some, and depending on how much you're up or down in the idea, you may want to use just behind a 14 period moving average, 50 period and so on, but again it's all about the chart timeframe you're trading.
Remember, there is never reward in stocks without risk, and more often than not the bigger the risk the bigger the potential reward. Therefore, it's far more about your timeframes, strategies and risk tolerance than anything else. And then, deciding behind what levels you're willing to accept in the event you or I are wrong.
Right now is clearly one of those times trader/investors should be addressing all of the above, because when these markets do finally decide to take a big enough breather there's the very high probability it's going to come swiftly. That's just the way these markets work anymore, and I seriously doubt that is going to change anytime soon. Therefore, it's hyper-important we make proactive decisions, and be completely willing to live with whatever the outcome may end up being.
Current Stance for Equities:
Create a Free Trial Here To See Our Current Stance for Equities: https://www.vikingcrest.com/register
Suggested Long-Term ETF Holdings:
Create a Free Trial Here To See Which ETFs We Continue to Suggest Investors Maintain Exposure To: https://www.vikingcrest.com/register
Individual Company Ideas:
Create a Free Trial Here To See Which Stocks We've Recently Suggested: https://www.vikingcrest.com/register
Important Strategy Tips On Trading, Investing, Portfolio Management and Using Our Service
Very important for any trader and investor who wants to be successful. To review a list of rules and disciplines to consider go here: https://www.vikingcrest.com/article/88. It's a good idea to review this article from time-to-time for any newly added rules.
To view our current trading ideas log-in here: https://www.vikingcrest.com/member. If you have any questions regarding a specific stock - even if it's something we haven't suggested - you can reply directly to this email, or call us at 619-369-9316.
John Monroe - Senior Editor and Analyst
